

4D DESIGN PROCESSES
PROJECT 2 process
Calms of the city
I planned to show 2 distinct locations, but have similar vibes between them. We start on a savannah street, birds chirping, wind blowing. The person is walking, maybe sitting reading. We are outside, but it feels warm and hopeful. Later we move inside to wind down for the night. The room is warm, and soft music is playing. We hear the gentle turn of a page as the person reads their book.
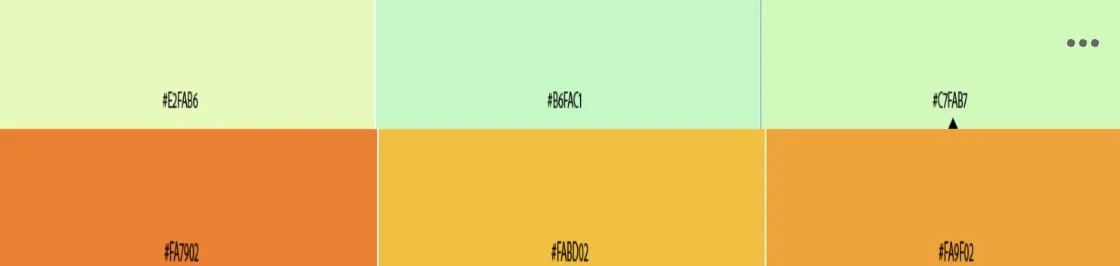
^ This was the color palette I used as reference while making the video ^
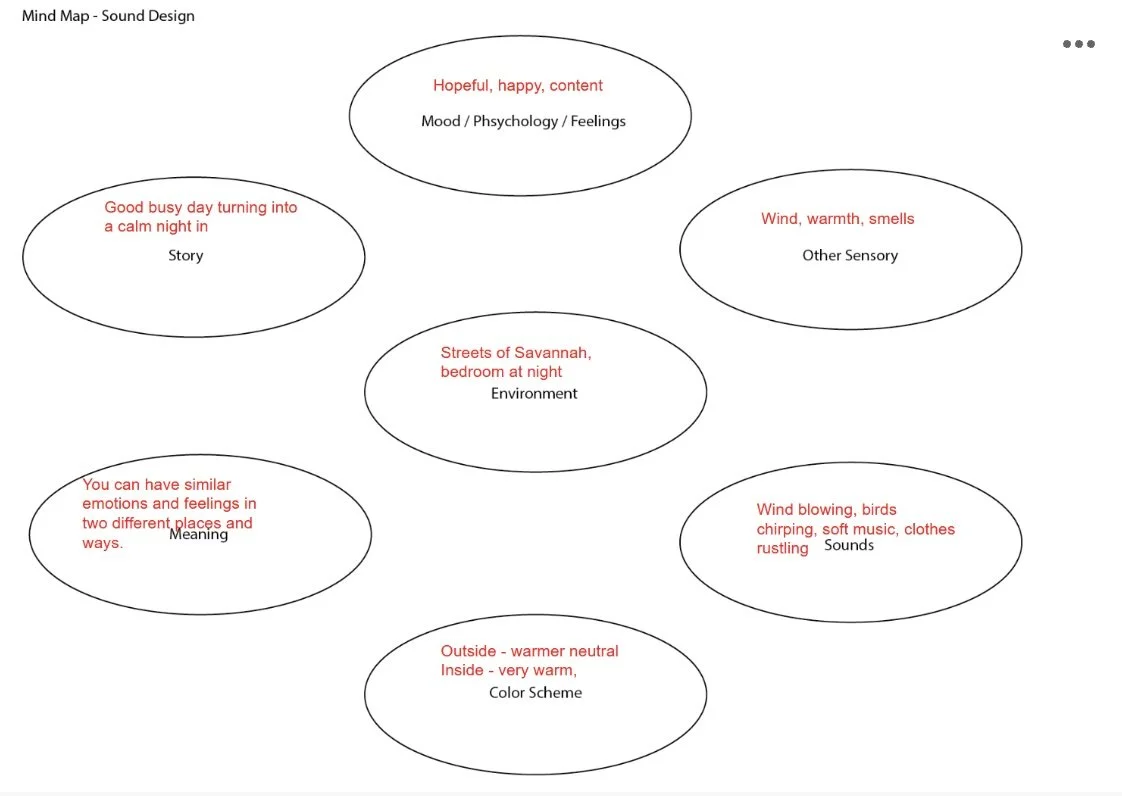
^ Here is my mind map to organize my thoughts about the project, and plan the emotion ^
PROJECT 3 process
How to tell if an image is ai in 60 seconds
This work is about spreading awareness about AI, and helping people build their ability to detect it in images.
I have use 2 techniques, a video and a website with a quiz. I wanted to engage the views after watching the video, so the quiz is a fun way for people to test their skills.
I am talking in the video I try to explain a few techniques and help people watching understand.
I like the quiz. I feel it is a fun thing that gets people engaged and talking about it with their friends.
In the future, I think I can improve it by adding more questions to the quiz, maybe make the video a bit longer. I would like to expand the video to detecting AI not just in still images, but also in videos.
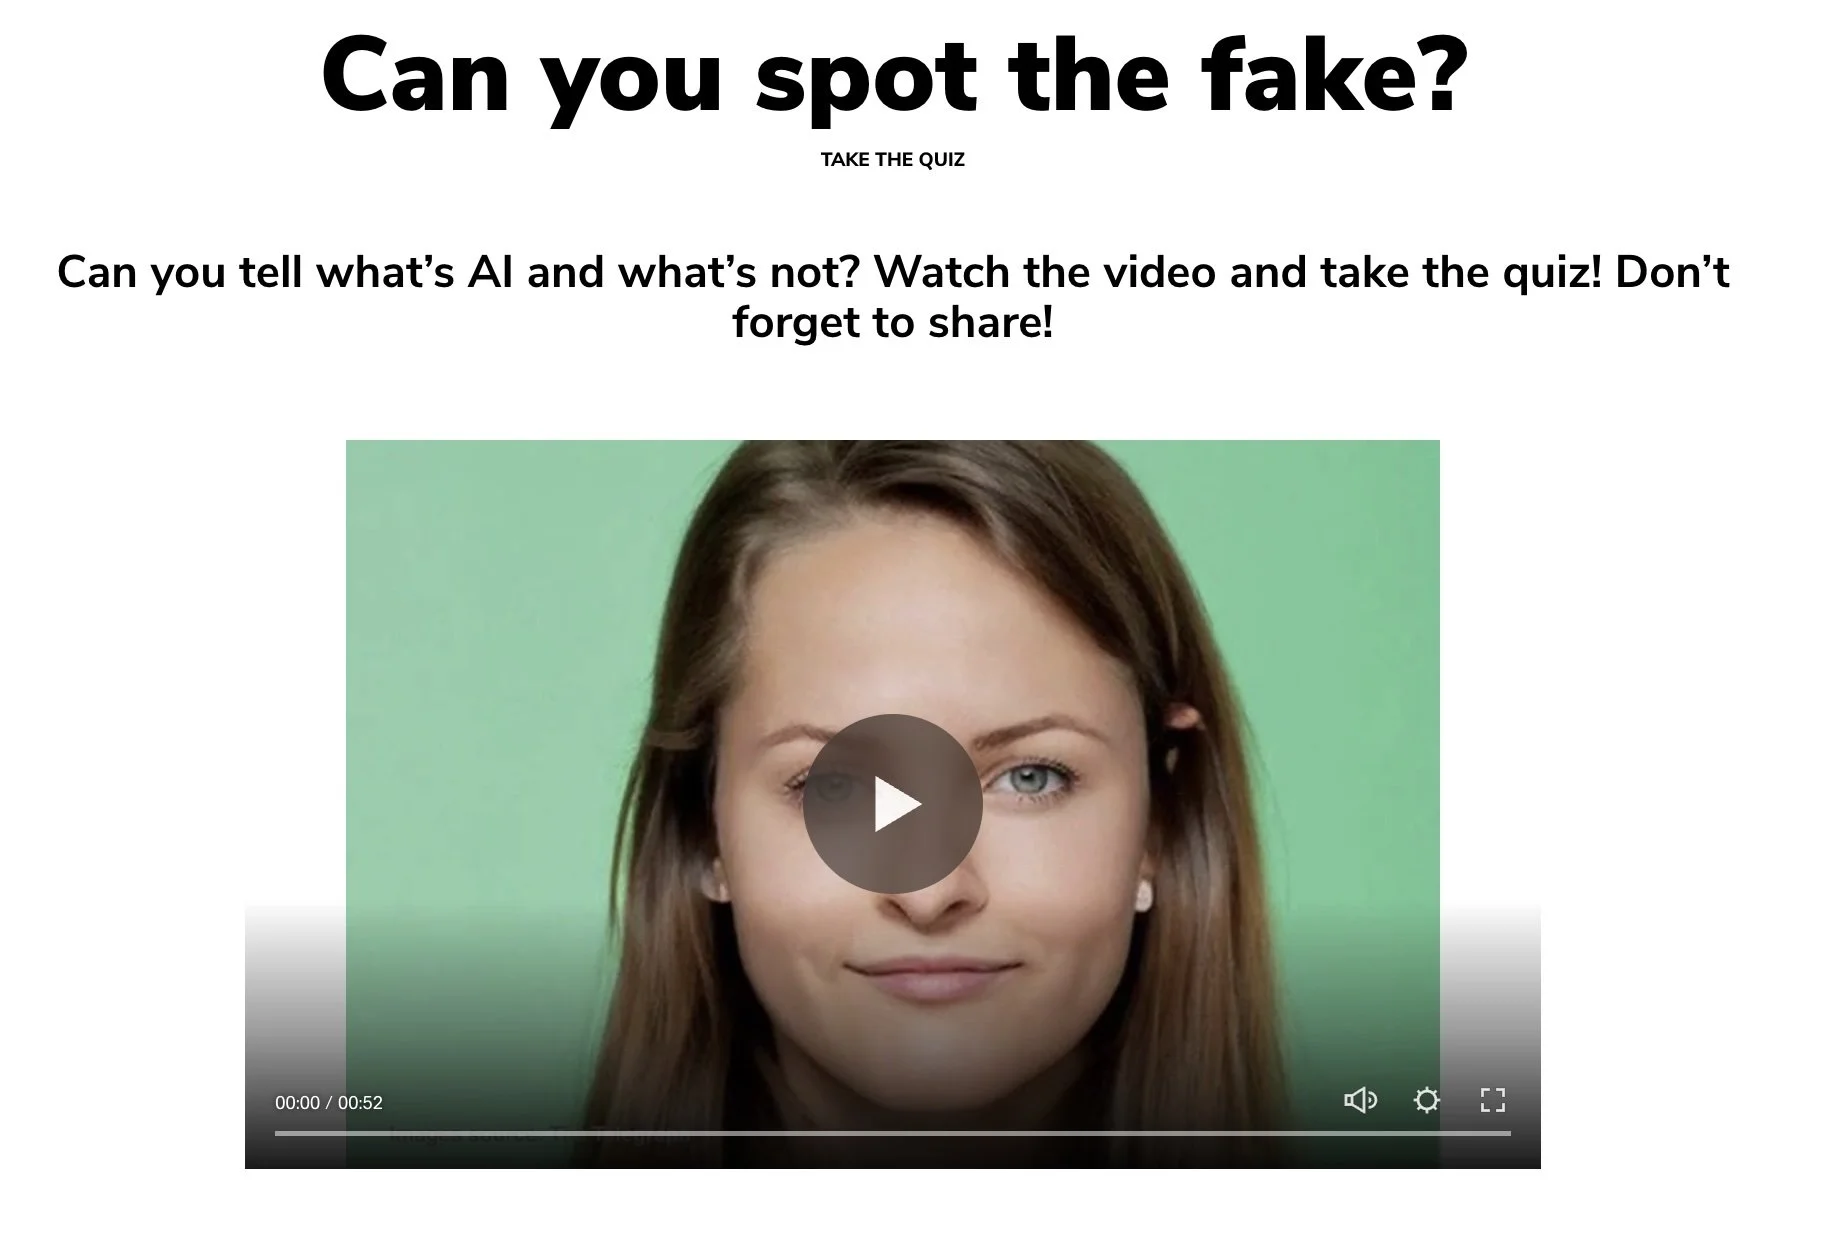
^ Homepage of the website quiz I made ^
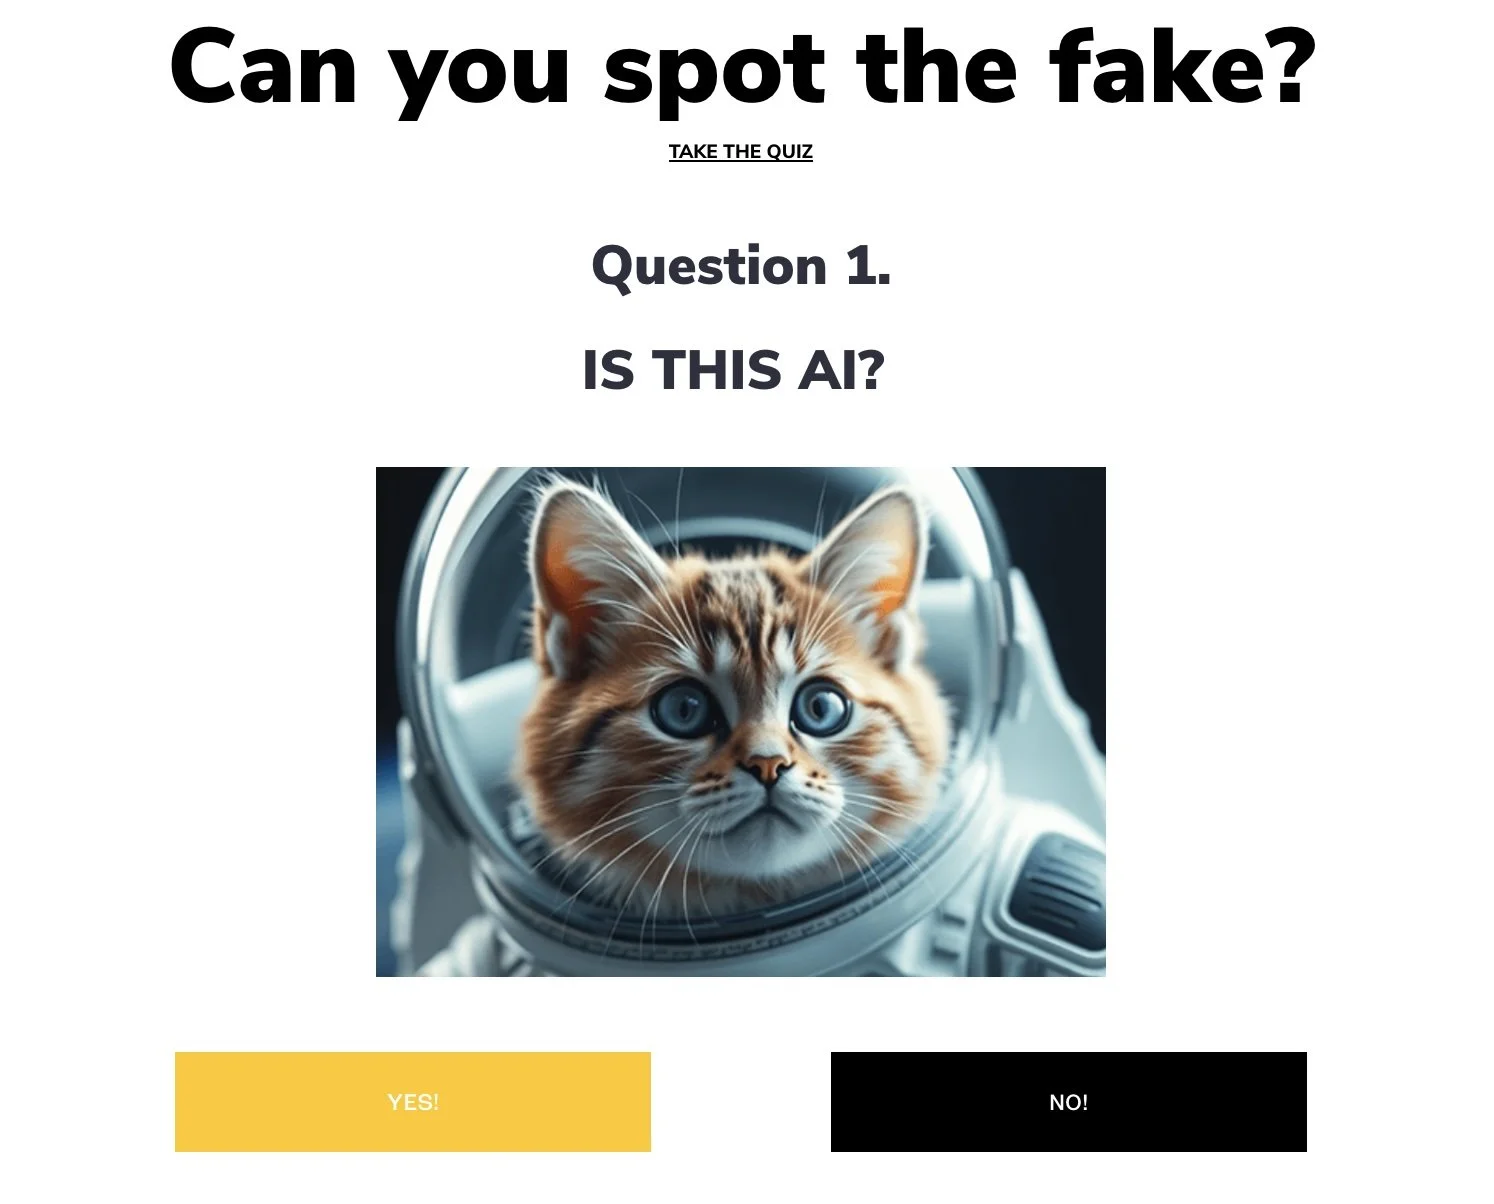
^ First question of the quiz ^
Overall I very much enjoyed the process of making this project. I thought the idea of making a quiz on the topic I made the video on to be very rewarding.
PROJECT 4 process
How do you spend your day? An exploration into screentime.
This work is about the screentime problem that is currently consuming SCAD student's time. This was inspired by a infographic I saw a while ago that showed that this current generation is predicted to spend over 30 years of their life looking at a screen. I decided to make a google form and send it out to my friends here at SCAD to take a sample of the student population, and organize the data into some charts that I then displayed in a short infographic style video. The goal is to clearly communicate the data that I collected, with goals to illustrate the larger problem to anyone watching. I really like the charts I ended up creating. I feel they do a great job at showing the data in a visual way, and the video does a good job of describing the problem at hand. I think I could work at improving the general production of the video, I would like to learn how to make more complex animation to further illustrate this topic in a video form.
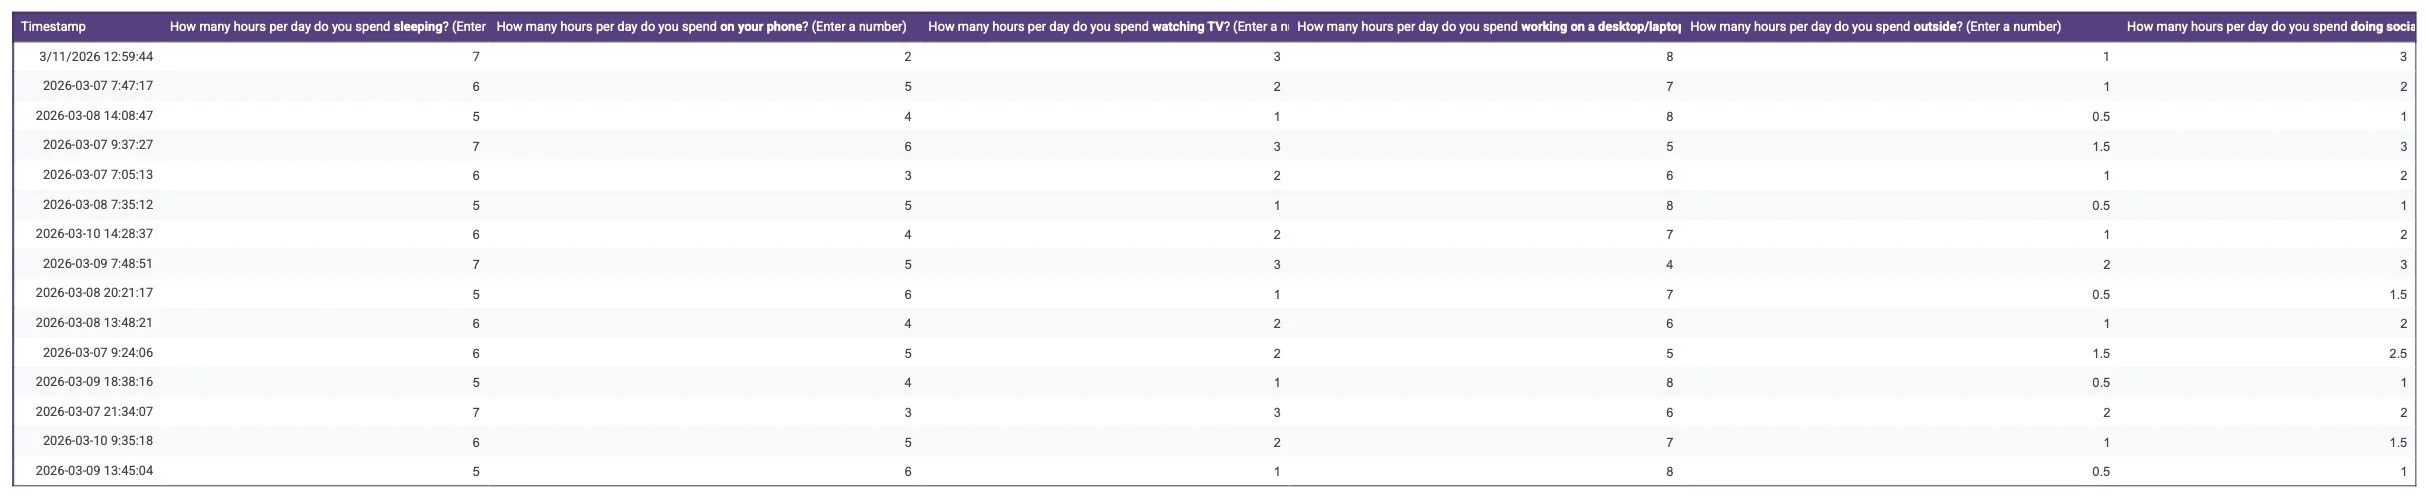
^ Here you can see the raw results of the form ^
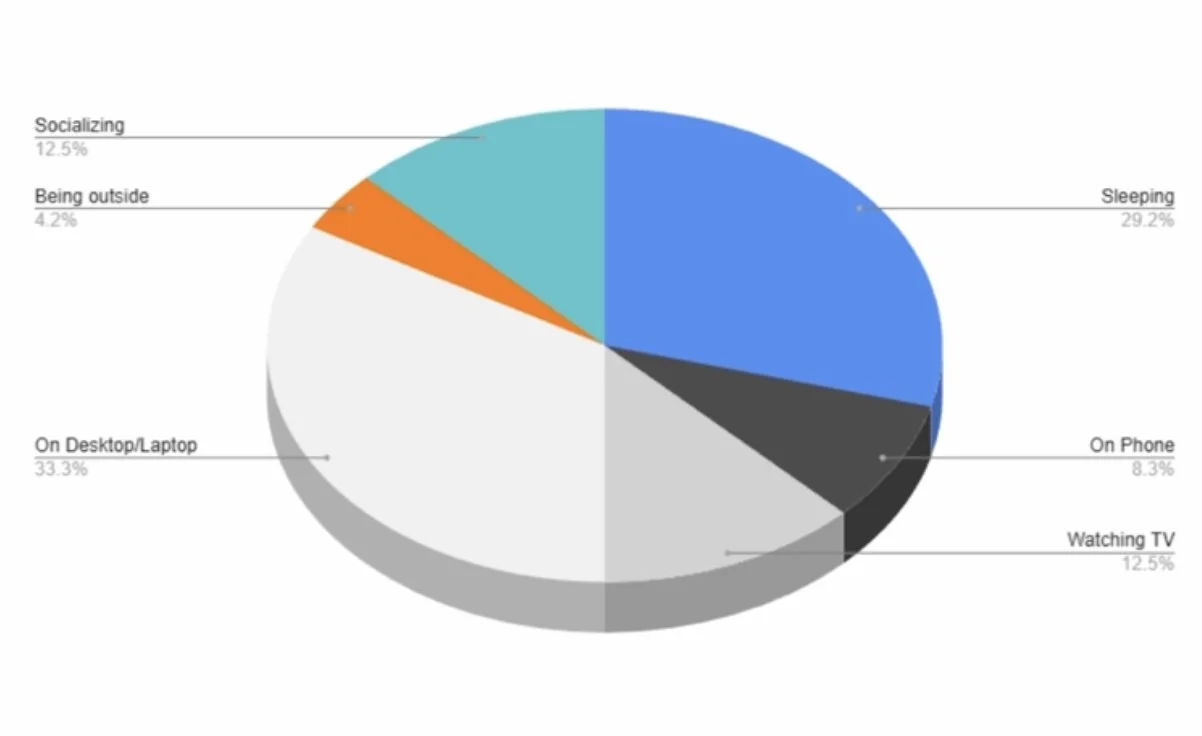
^ Here are all the results graphed ^
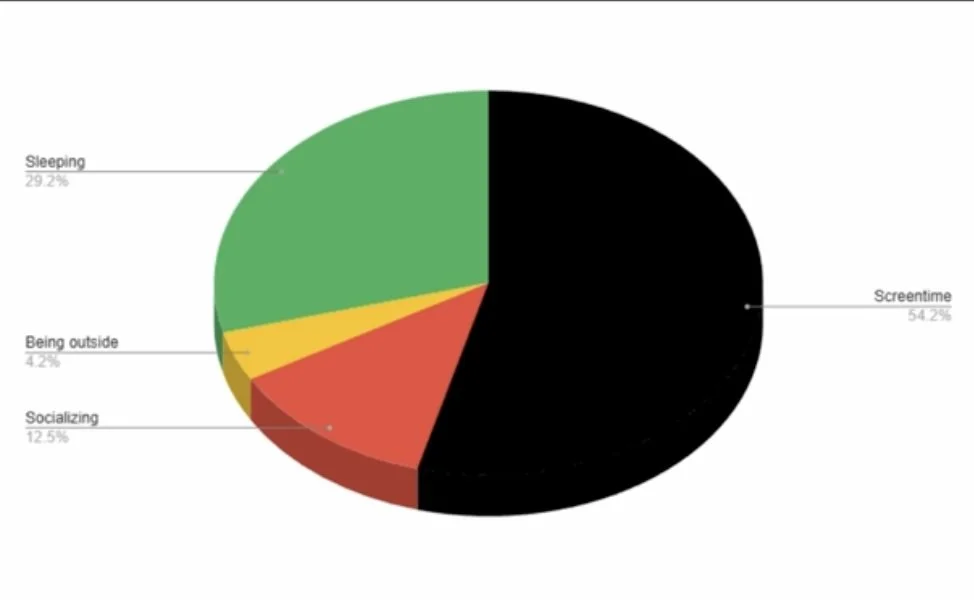
^ Here is the breakdown of screentime vs other activities ^